Introduction
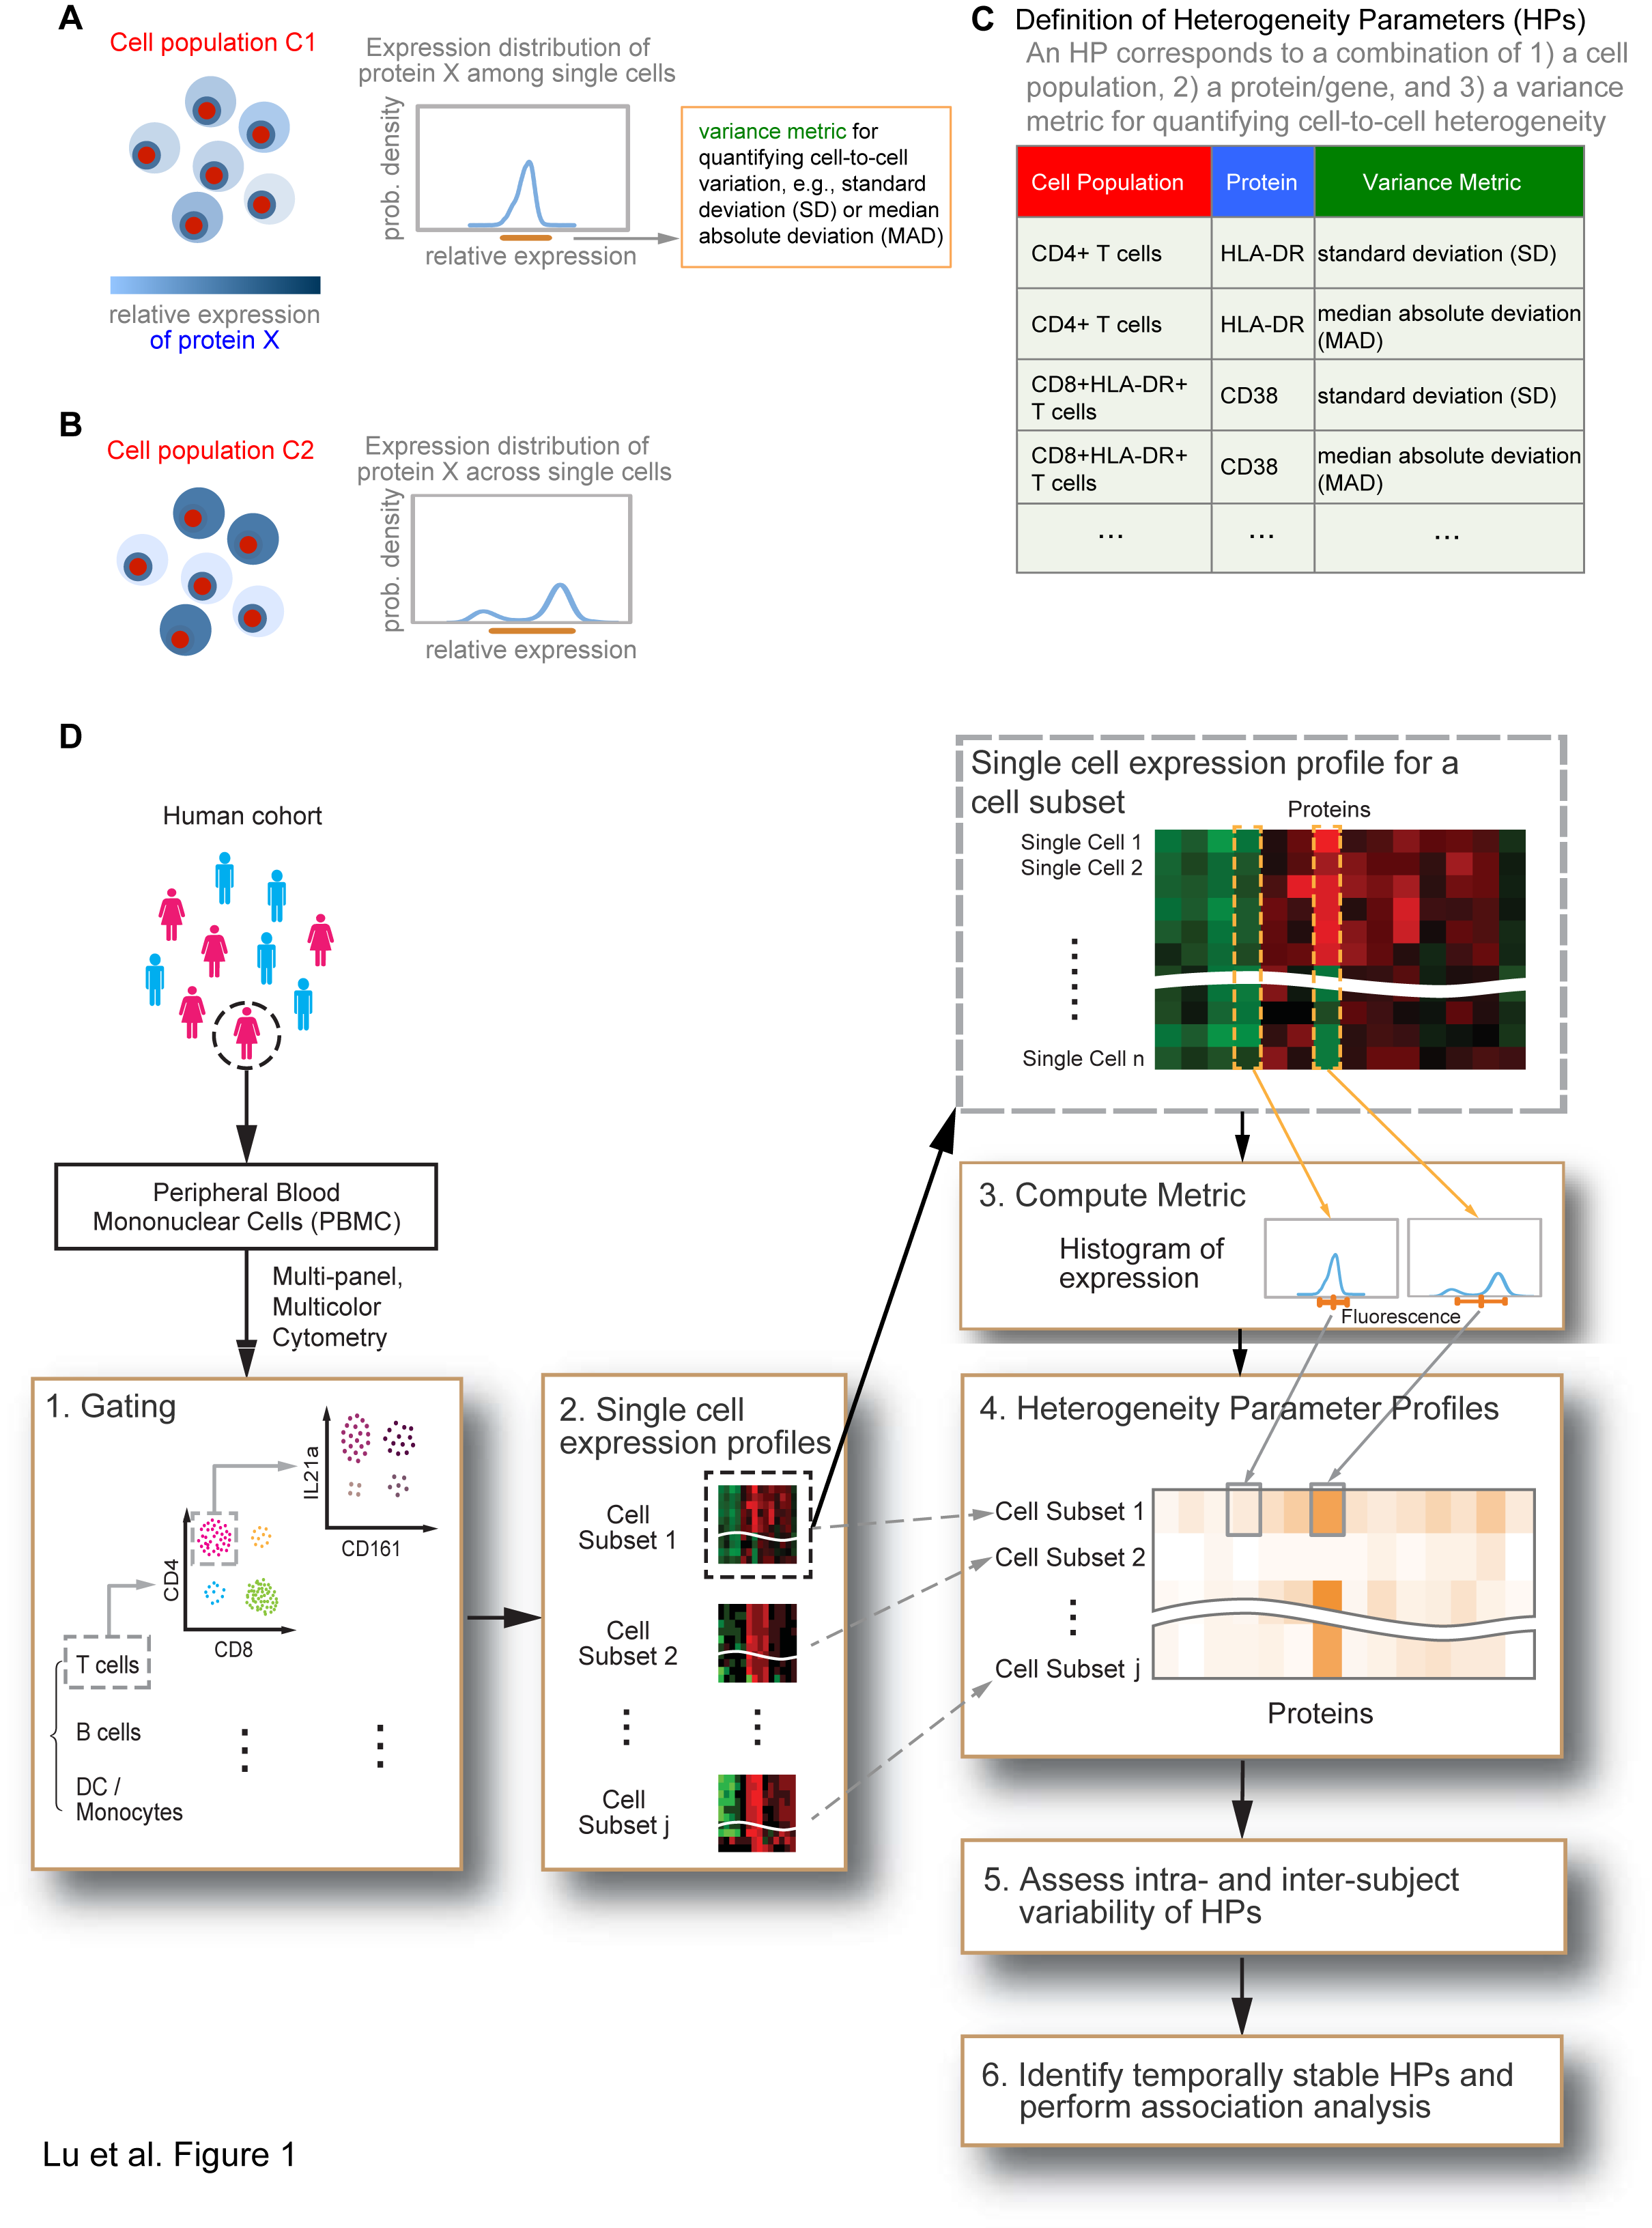
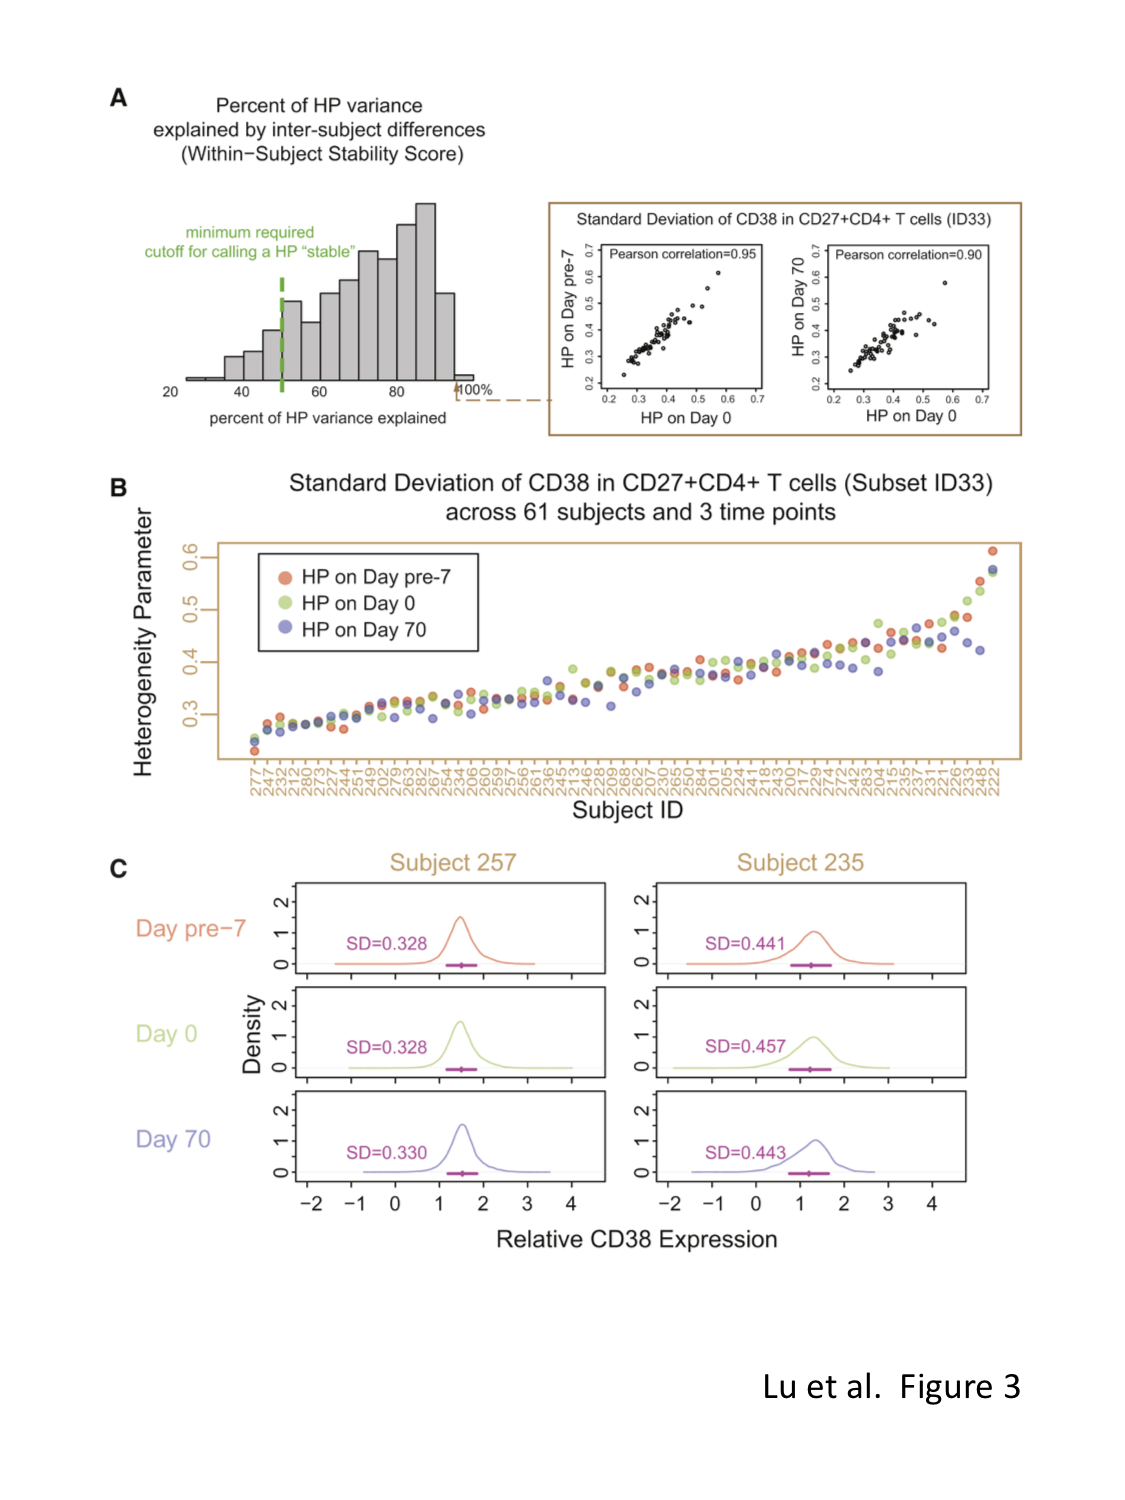
This web site provides interactive figures (iFigs) for a recent study of protein expression heterogeneity in human immune cells conducted by Dr. John Tsang's group (Systems Genomics and Bioinformatics Unit) at the Laboratory of Systems Biology, National Institute of Allergy and Infectious Diseases and the Trans-NIH Center for Human Immunology. Below, the user can select to view a depiction of the study design (Figure 1), explore the heterogeneity parameters (HPs) within individual subjects (Figure 2), view examples of temporally stable HPs (Figure 3), inspect HPs associated with age (Figure 4), or inspect HPs associated with single nucleotide polymorphisms previously found by genome-wide association studies (GWAS) to be associated with diseases/human traits (Figure 5). The user can also check out an overview of the data processing and transformation steps, or use the Data Browser to explore the distribution of protein expression in different cell subsets and subjects. Our raw data/software and documentation are also available for download.Overview of the analysis framework
Click the heatmap to show the underlying single cell distribution.
Select an age-associated Heterogeneity Parameter:
Plot:
x axis: expression level of the protein
y axis: frequency of cells in the subset
N: number of cells in the cell subset.
p_dip: P value from the dip test for evaluating unimodality of the distribution. A small p value (e.g. <0.05) rejects the null hypothesis that the distribution is unimodal.
Definitions of cell subsets can be found in the Data Browser section of this website.
Select a SNP-associated Heterogeneity Parameter:
Plot:
x axis: expression level of the protein
y axis: frequency of cells in the subset
N: number of cells in the cell subset.
p_dip: P value from the dip test for evaluating unimodality of the distribution. A small p value (e.g. <0.05) rejects the null hypothesis that the distribution is unimodal.
Definitions of cell subsets can be found in the Data Browser section of this website.
Step 1. Select a cell subset and a protein
Step 2. Select time points:
Step 3: Select subjects
Plots
About this server
This web server is developed by Dr. Yong Lu (email), Systems Genomics and Bioinformatics Unit, Laboratory of Systems Biology, NIAID.
Contact Us
Please send all inquiries to Drs. Yong Lu (email) or John Tsang (email).
Accessibility
We are making every effort to ensure that the information available on this site is accessible to all. If you use special adaptive equipment to access the internet and encounter problems when using this web server, please let us know. We will try to provide the information to you in an alternate format.
Please contact Drs. Yong Lu or John Tsang with the information on which you need assistance, along with a description of the problem.